Target
Halve the gap for Indigenous Australians aged 20–24 in Year 12 attainment or equivalent (by 2020)
Key points
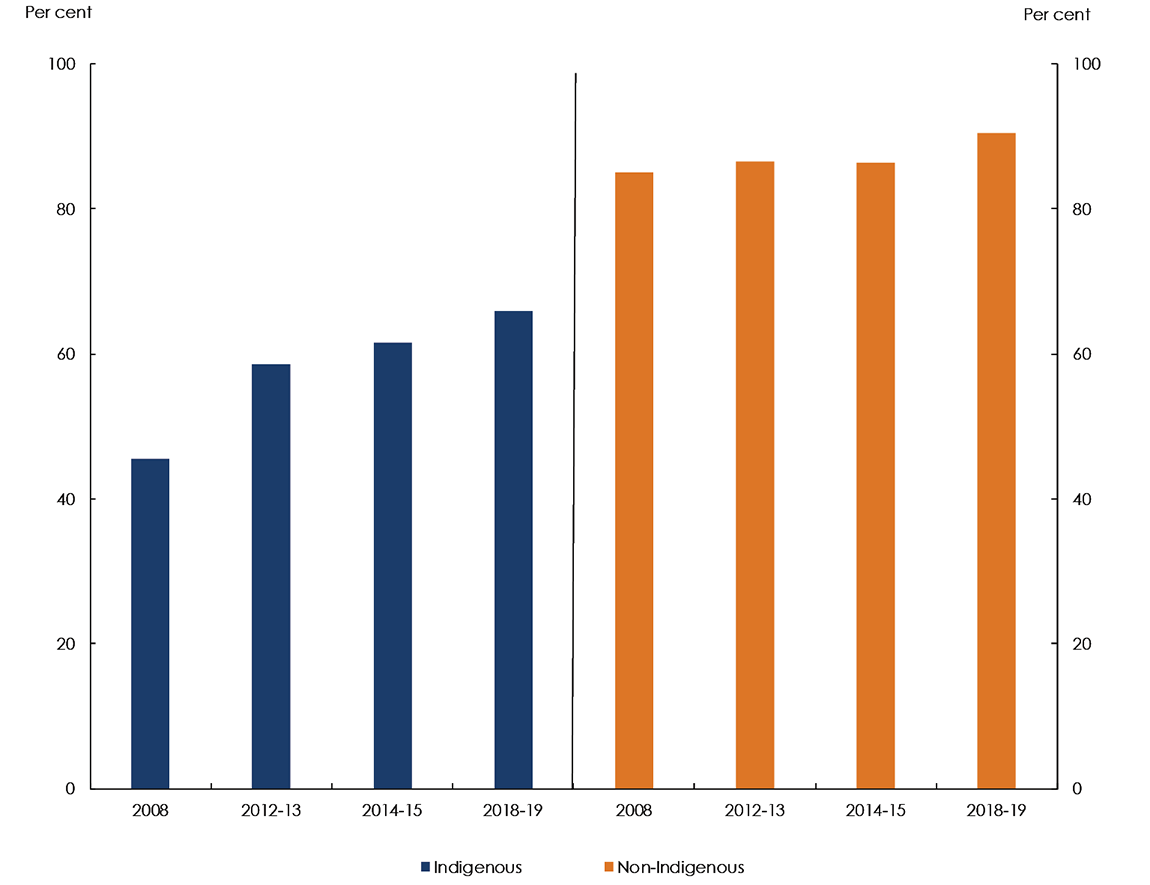
- In 2018–19, around 66 per cent of Indigenous Australians aged 20–24 years had attained Year 12 or equivalent.
- Between 2008 and 2018–19, the proportion of Indigenous Australians aged 20–24 years attaining Year 12 or equivalent increased by around 21 percentage points. The gap has narrowed by around 15 percentage points, as non-Indigenous attainment rates have improved at a slower pace.
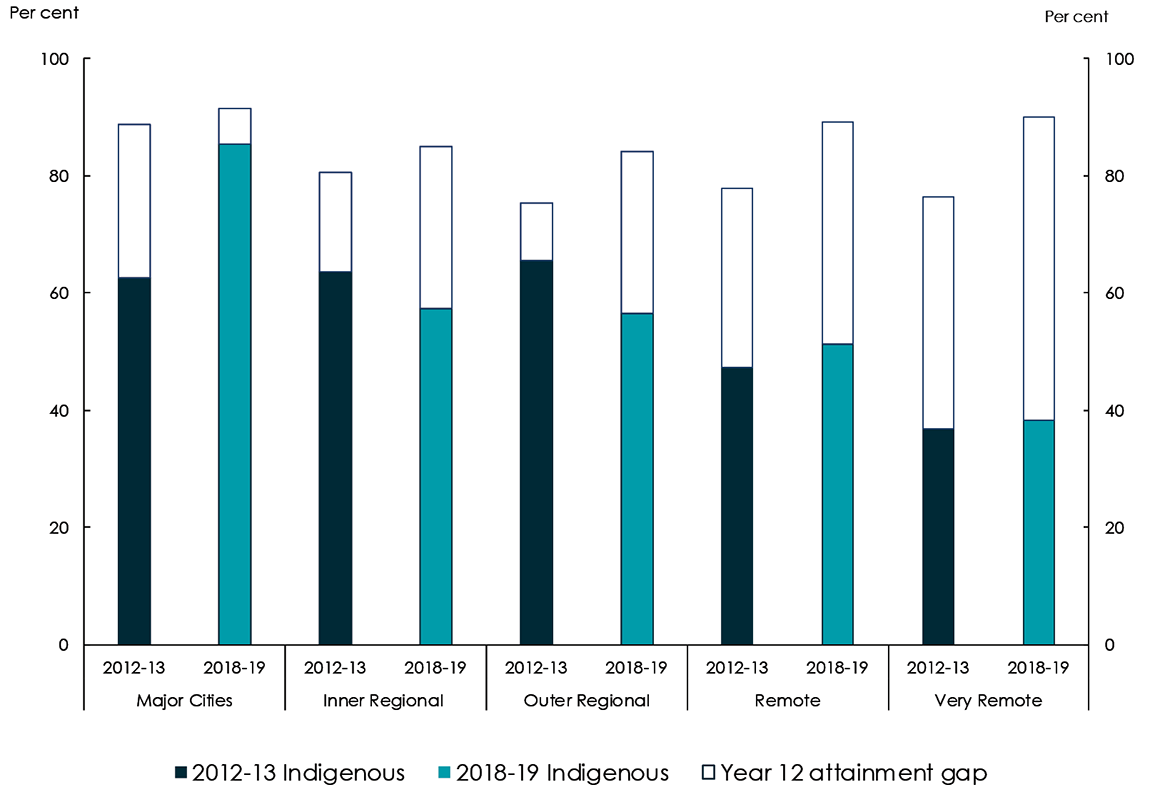
- The biggest improvement in Year 12 attainment rates was in Major Cities, where the gap narrowed by around 20 percentage points—from 26 percentage points in 2012–13 to 6 percentage points in 2018–19.
What the data tells us
National
The target to halve the gap in Year 12 or equivalent attainment rates by 2020 is on track.
One of the main indicators of educational achievement is completing high school to Year 12. This is a prerequisite for many jobs and is seen as an indicator of aptitude and attitude (Biddle 2010). Indigenous Australians, who complete Year 12, or a higher qualification, are substantially more likely to be employed. They are also more likely to work full-time and in higher-skilled occupations than early school leavers (Shirodkar et al. 2018; Venn 2018).
The Year 12 attainment rate is the proportion of 20–24 year old Indigenous Australians who have completed Year 12 or obtained a Certificate level II or above qualification. The two data sources used to measure progress against this target are the Australian Bureau of Statistics (ABS) Census of Population and Housing (Census),1 and the ABS National Aboriginal and Torres Strait Islander Health Survey (NATSIHS) 2018–19.2
Over the past decade, the Year 12 attainment rate for Indigenous Australians increased by around 21 percentage points, from around 45 per cent in 2008 to 66 per cent in 2018–19. The proportion of non-Indigenous students attaining Year 12 or equivalent also increased, but by a smaller amount (around 5 percentage points). As such, the gap has narrowed by 15 percentage points—from around 40 percentage points in 2008 to 25 percentage points in 2018–19 (Figure 5.1).
Year 12 attainment is associated with a range of complex and multi-faceted factors. Enablers and barriers include: prior educational experience, academic ability, access to secondary schools (particularly for those in remote communities), and financial and other support from parents (Biddle and Cameron 2012). Students thrive at schools that engage with communities, provide a culturally inclusive curriculum with appropriate support, and have skilled teachers with high expectations (Ockenden 2014; Osborne and Guenther 2013; McRae 2002; Stronger Smarter Institute 2014).
Sources: Australian Bureau of Statistics, National Aboriginal and Torres Strait Islander Social Survey 2008, Unpublished, ABS: Canberra; Australian Bureau of Statistics, 2014, Australian Aboriginal and Torres Strait Islander Health Survey: Updated Results 2012–13, Cat. no. 4727.0.55.006, ABS: Canberra; Australian Bureau of Statistics, 2016, National Aboriginal and Torres Strait Islander Social Survey 2014-15, Cat. no. 4714.0, ABS: Canberra; Australian Bureau of Statistics, 2019, Australian Aboriginal and Torres Strait Islander Health Survey 2018–19, Cat. no. 4715.0, ABS: Canberra; Australian Bureau of Statistics, 2008, 2012, 2014, and 2018, Education and Work, Australia, May 2008, 2012, 2014, and 2018, Cat. no. 6227.0, ABS: Canberra.
Note:
- Trajectories are not able to be included for the supplementary NATSIHS data. For trajectories based on the 2016 Census, see the Closing the Gap Report 2019.
View the text alternative for Figure 5.1.
States and territories
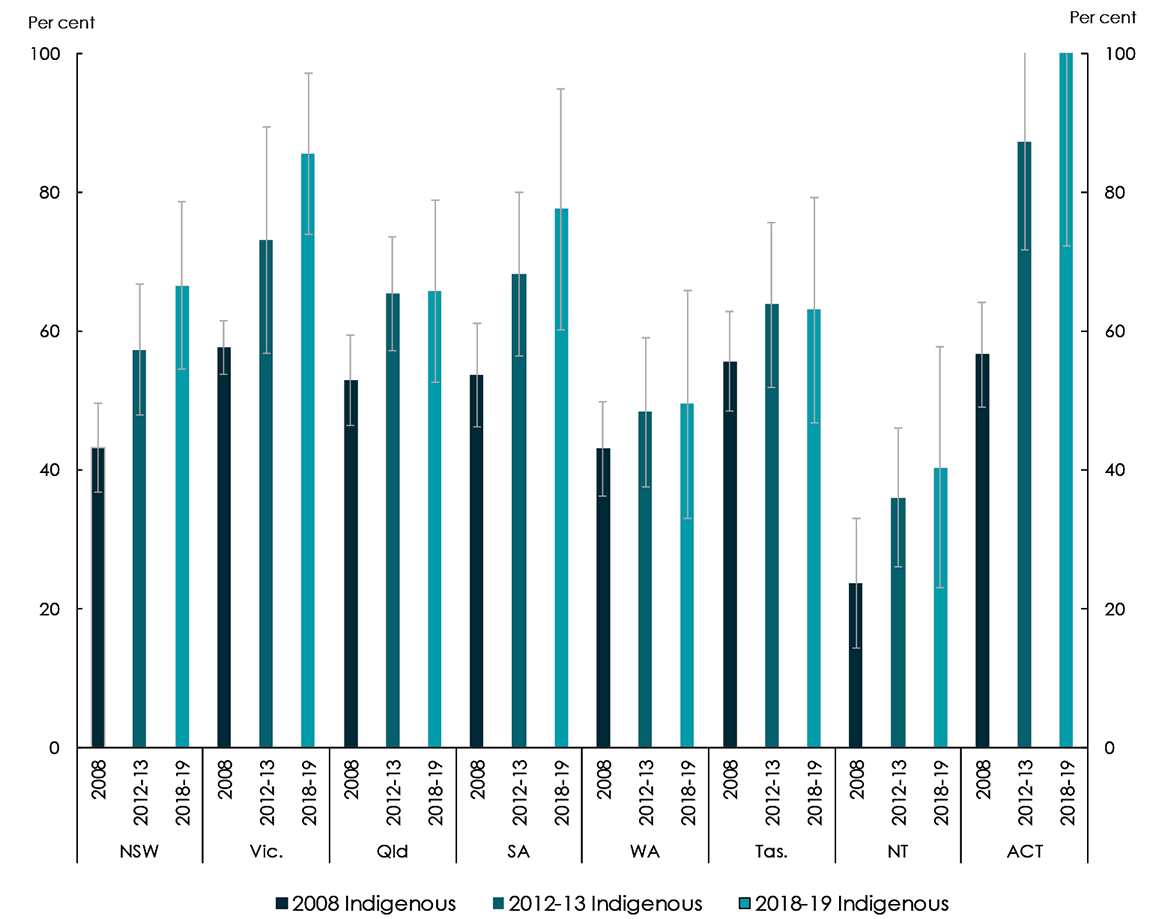
Over the past decade, there have been improvements in Indigenous Year 12 attainment rates across all jurisdictions. The greatest increase was in the Australian Capital Territory (Figure 5.2). 3,4
Sources: Australian Bureau of Statistics. National Aboriginal and Torres Strait Islander Social Survey 2008, Unpublished, ABS: Canberra; Australian Bureau of Statistics 2019. Australian Aboriginal and Torres Strait Islander Health Survey 2018–19, Cat. no. 4715.0 ABS: Canberra; Australian Bureau of Statistics 2014. Australian Aboriginal and Torres Strait Islander Health Survey: Updated Results 2012–13, Cat. no. 4727.0.55.006 ABS: Canberra; Australian Bureau of Statistics 2008, 2012, 2014, and 2018. Education and Work, Australia, May 2008, 2012, 2014, and 2018, Cat. no. 6227.0, ABS: Canberra.
Note:
- Confidence intervals reflect the level of uncertainty associated with the measurement of attainment. They define a range of values within which the actual level of attainment is likely to lie. Due to the large confidence intervals for Indigenous Year 12 attainment estimates in individual state and territories, caution should be exercised when making direct comparisons between these estimates.
View the text alternative for Figure 5.2.
Remoteness
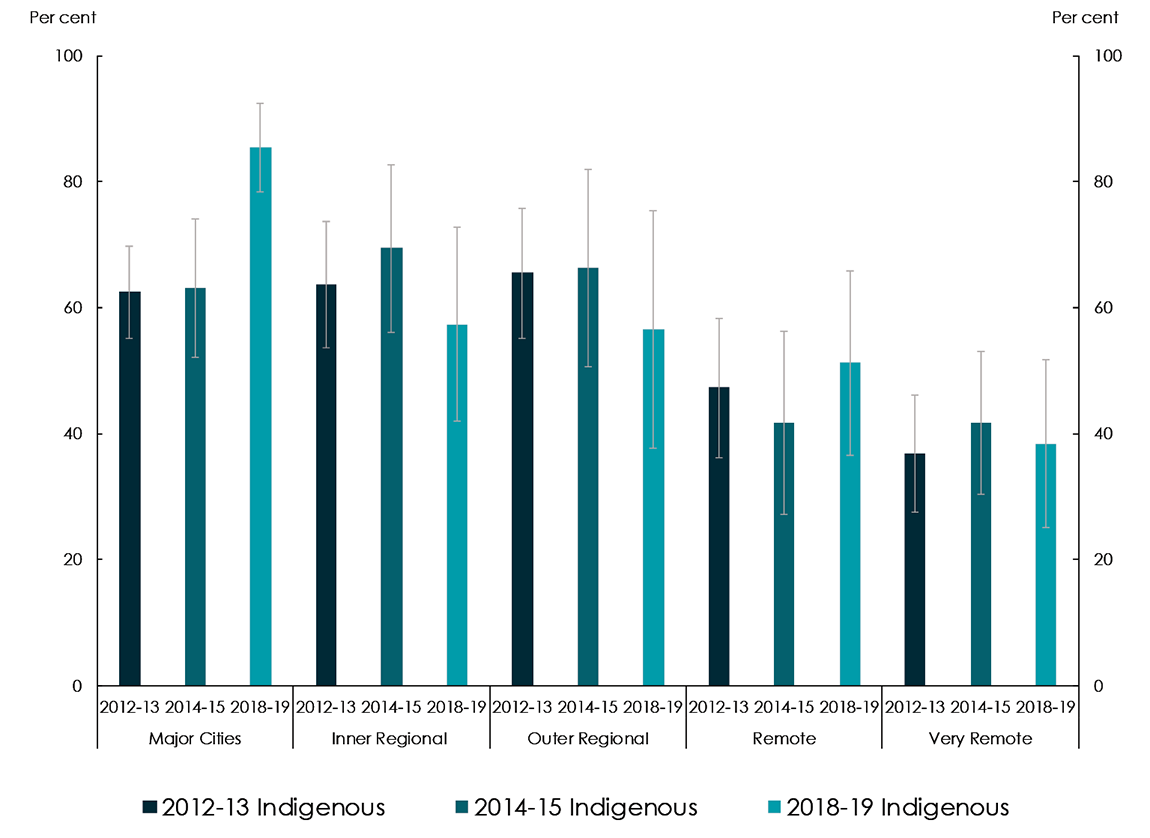
The proportion of Indigenous Australians aged 20–24 years attaining Year 12 or equivalent level of education decreases with remoteness. The Year 12 attainment rate is 85 per cent in Major Cities compared with 38 per cent in Very Remote areas.
Major Cities experienced the largest increase in the proportion of Indigenous students who had attained Year 12 or equivalent (Figure 5.3). In Major Cities, where over 40 per cent of the Indigenous population aged 20–24 years live, the Year 12 attainment rate increased by around 22 percentage points, from 63 per cent in 2012–13, to 85 per cent in 2018–19.5
Sources: Australian Bureau of Statistics,2016, National Aboriginal and Torres Strait Islander Social Survey 2014-15, Cat. no. 4714.0, ABS: Canberra, Australian Bureau of Statistics, 2019. Australian Aboriginal and Torres Strait Islander Health Survey 2018–19, Cat. no. 4715.0, ABS: Canberra; Australian Bureau of Statistics, 2014. Australian Aboriginal and Torres Strait Islander Health Survey: Updated Results 2012–13, Cat. no. 4727.0.55.006 ABS: Canberra.
Note:
- Confidence intervals reflect the level of uncertainty associated with the measurement of attainment. They define a range of values within which the actual level of attainment is likely to lie. Due to the large confidence intervals for Indigenous Year 12 attainment estimates in remoteness areas, caution should be exercised when making direct comparisons between these estimates.
View the text alternative for Figure 5.3.
In 2018–19, the gap in Year 12 attainment rates was narrowest in Major Cities (around 6 percentage points) and widest in Very Remote Australia (around 52 percentage points). Between 2012–13 and 2018–19, the gap between Indigenous and non-Indigenous Australians widened in all areas, except for Major Cities (Figure 5.4).6
Sources: Australian Bureau of Statistics, 2014, Australian Aboriginal and Torres Strait Islander Health Survey: Updated Results 2012–13, Cat. no. 4727.0.55.006, ABS: Canberra; Australian Bureau of Statistics, 2019, Australian Aboriginal and Torres Strait Islander Health Survey 2018–19, Cat. no. 4715.0, ABS: Canberra.
View the text alternative for Figure 5.4.
[1] The Census is the primary data source. The next Census will be conducted in 2021.
[2] This NATSIHS is a supplementary data source and is not directly comparable with Census data. Caution should be taken when Interpreting NATSIHS data at disaggregated levels (i.e. by jurisdiction or remoteness). See the Technical Appendix for further information.
[3] Note that cross-border enrolment in the Australian Capital Territory has a larger impact on the statistics than other jurisdictions due to a smaller population. It is not unusual for rates in the Australian Capital Territory to exceed 100 per cent. This is mainly due to the enrolment of students who are usual residents in the surrounding New South Wales regions.
[4] Jurisdictional progress using 2016 Census data is available in Figure 20; Closing the Gap: Prime Minister's report 2018.
[5] The increase in Indigenous population between the 2011 and 2016 Census was partially due to changes in Indigenous identification. See the Technical Appendix for further information.
[6] These results are not statistically significant for Inner Regional and Remote areas.