Target trajectories
The purpose of the trajectories is to provide a guide as to whether the current trends are on track to achieving the targets within the target timeframes. Assessment of progress needs to take into account the limitations of both the trajectories and of the data sources used to measure outcomes.
The trajectories suggest an indicative direction of change needed to meet the target and do not attempt to provide an exact measure of predicted progress each year. This acknowledges that there are too many factors impacting upon progress in order to accurately predict when the expected change would occur over the period of the target.
Policy interventions can take a number of years to roll out and it can be many years before the impact upon outcomes can be measured. As such, the binary ‘on track’/’not on track’ determination is limited in conveying progress and should not be used in isolation. This is why Closing the Gap reports have provided other measures of progress to inform governments and the public.
Population estimates and projections
In July 2019 the Australian Bureau of Statistics (ABS) released Estimates and Projections, Aboriginal and Torres Strait Islander Australians, 2006 to 2031 based on the 2016 Census. These new population estimates and projections have been used as denominators for calculating Indigenous statistics (and consequently non-Indigenous comparator statistics) for government reporting. The purpose of this change is to ensure that Indigenous population statistics more closely reflect the 2016 Indigenous Estimated Resident Population based on the 2016 Census. Previous estimates and projections had been based on the 2011 Census, and the Indigenous population has changed since that time. Consequently, statistics published in this report that rely on population estimates and projections are not comparable with previously published statistics.
This change affects child mortality, early childhood education enrolment and the age-standardised mortality rates used as a supporting indicator for the life expectancy target. Furthermore, this change has also required revisions to the trajectories for these targets in order to ensure consistency in the data sources for monitoring progress against the targets over time. As such previously published results for these targets are not comparable with those in this report.
The population estimates include ‘backcast’ population denominators to allow for time series analysis using a demographically consistent data source. These are population estimates going back in time, to better reflect the Indigenous population estimated from the 2016 Census counts of Indigenous Australians, adjusted for net undercount as measured by the Post Enumeration Survey. There are also projections for future years which will provide the denominators for the next five years of reporting until the estimates are updated again following the 2021 Census. These projections are also used for target trajectories and are produced using demographic assumptions on future levels of fertility, paternity, migration and life expectancy. These projections were compiled without an assumption of changes in Indigenous identification.
The ABS published these estimates and projections spanning the period 2006 to 2031 which covers the timeline for the current Closing the Gap targets. However, the ABS also provided additional backcast estimates for the period 1998 to 2006 to support analysis of mortality targets prior to the baseline years. The reliability of backcast population estimates tends to decrease the further away the time series moves from the Census upon which they are based. This potentially makes the Indigenous mortality rates over the period 1998 to 2006 less reliable than rates since 2006 and hence, rates prior to 2006 should be interpreted with caution.
The growth in the Indigenous population between the 2011 and 2016 Census counts reflects both demographic factors (births, deaths and migration) as well as other non‑demographic factors including changes in the propensity to identify as Indigenous in the Census.
The ABS found that measuring the impact of changes in the propensity to identify is complex. Intercensal improvements in some outcomes appear to be a result of demographic and geographic population change, genuine progress and changes in propensity to identify. However, the way these factors contribute is not consistent across indicators (ABS 2018). Markham and Biddle (2017) also highlighted the potential for identification changes to confound changes in socioeconomic outcomes between the 2011 and 2016 Censuses, and urged caution in interpreting such changes.
This complexity suggests that where the data allow, analysis of variation in outcomes within the Indigenous population (such as by geography or by socioeconomic status) will help provide greater understanding of where improvements are most greatly needed. For example, in last year’s report life expectancy at birth was analysed by remoteness and by socioeconomic status.
Other datasets that supply the numerators for the targets are also subject to data quality issues such as changes in identification of Indigenous status, lags in registrations and volatility caused by small numbers.
Confidence intervals and statistical significance
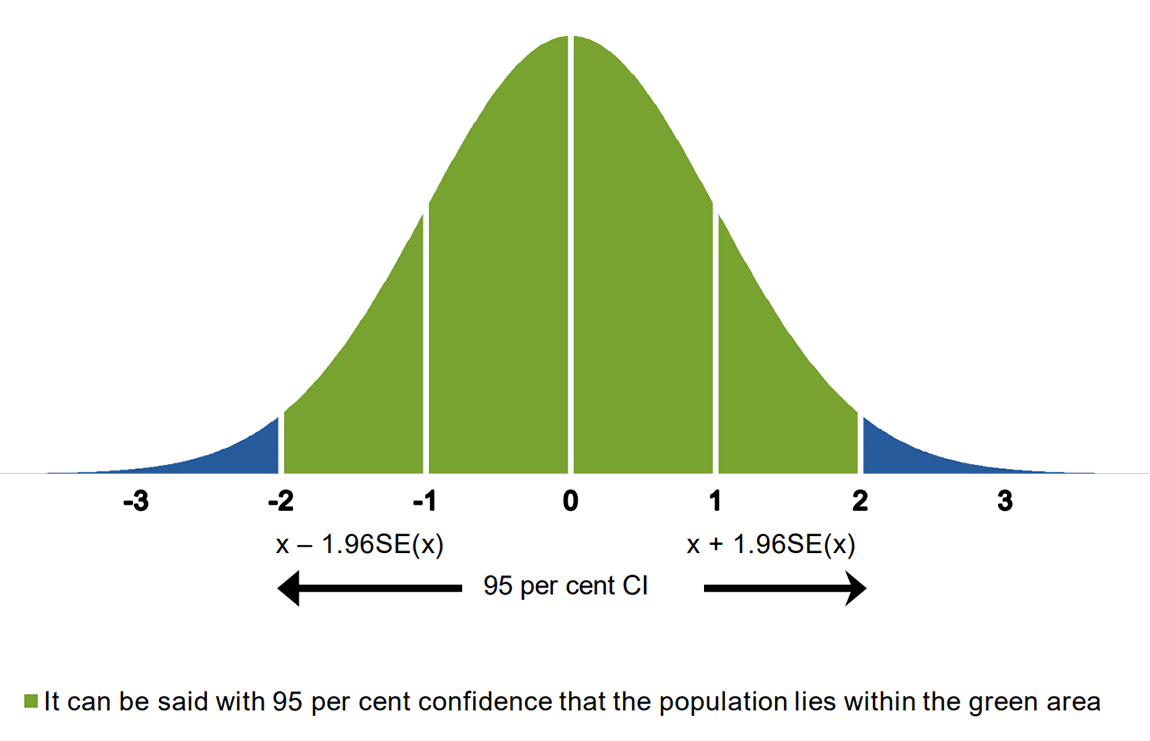
Confidence intervals (CIs) are used to indicate the reliability of an estimate. A CI is a specified interval, with the sample statistic at the centre, within which the corresponding population value can be said to lie with a given level of confidence (ABS 2013). CIs are calculated from the population estimate and its associated Standard Error. The CIs used in this report are at the 95 per cent level of probability (Figure 1).
CIs can be used to test whether the results reported for two estimated proportions are statistically different. If the CIs for the results do not overlap, then there can be confidence that there is a statistically significant difference between the estimated proportions. In some scenarios where the CIs do overlap, the estimated proportions may yet be statistically significantly different.
The t-test is used to test whether changes in trends (including point estimates and gaps over time) are significantly different at the 5 per cent level of significance.
Per cent change in mortality rates in the Child Mortality and Life Expectancy chapters are derived through linear regression analysis, and tested at the 5 per cent level of significance.
Source:
Productivity Commission 2019, Report on Government Services 2019 Statistical context.
View the text alternative for Figure 1.
Child mortality
Measurement of Indigenous child mortality rates is particularly susceptible to quality issues in the data sources used for the population (denominator) and the number of registered deaths (numerator).
The relatively small number of Indigenous child deaths is volatile from year to year. This can reflect real variations in the numbers of deaths, lags in the registration of deaths, and changes in Indigenous identification in the deaths data. Descriptions of these issues have been covered in past Closing the Gap reports.
The 2015 Closing the Gap Report explained that the 2012 Indigenous child mortality rate appeared to be uncharacteristically low. This likely reflected the unusually large number of Indigenous infant deaths that occurred in 2012, but were registered in 2013, leading to a likely understating of mortality rates in 2012 and an overstating of mortality rates in 2013.
The 2019 Closing the Gap Report explained that in 2015, Queensland included Indigenous status from the Medical Certificate of Cause of Death which led to an increase in the number of deaths identified as Indigenous. Although this was an improvement in data quality it nonetheless contributed to data volatility and thus caution is required in interpreting annual variation.
The population and deaths data sources are subject to different levels of Indigenous identification and both are impacted by lags in the registration of births and deaths.
As discussed above, the reliability of backcast population estimates tends to decrease the further away the time series moves from the Census upon which they are based. This potentially makes the Indigenous mortality rates over the period 1998 to the 2008 baseline less reliable than rates since 2008. This is of greater relevance with the change to using the 2016 Census-based population estimates. Further, there has also been uncharacteristically slow population growth in the Indigenous child population estimates between 2011 and 2018. Over the same period, the number of Indigenous child deaths stopped declining. As such, with no trend in the numerator or denominator, the mortality rates plateaued.
The slow population growth is (at least partly) attributable to slow or negative growth in Indigenous births registrations during this period. Birth registrations data is one of the data sources used to inform the population estimates, and it too is subject to changes in Indigenous identification as well as occasional lags in birth registrations.
The child mortality trajectory has also been revised to include the 2016 Census-based population estimates. The target end point has been revised to reflect the result needed to halve the gap (as measured at the 2008 baseline) added to the 2018 non‑Indigenous child mortality rate (the latest available). The 2018 Indigenous child mortality rate is then presented for comparison against the revised target end point.
Because the target ceases with the 2018 data, the target end point is based on the actual non‑Indigenous rate. In previous years, the target end point was based on the modelled non-Indigenous trajectory. As the target end point is now known, the Indigenous trajectory has been recast back to the 2008 baseline. Therefore, these findings are not comparable to previously published results. However, as foreshadowed in last year’s report, the target was not met.
Early childhood education
For this report, previously published rates of enrolment in early childhood education have been revised due to the application of the new 2016 Census-based population estimates. This provides for a consistent data source to enable comparison of enrolment rates for 2016, 2017 and 2018.
Because of these revisions, including to the 2015 target baseline, the trajectory to the 95 per cent target benchmark has also been revised. This allows the revised enrolment rates to be compared with the trajectory for monitoring progress to achieve the target. Accordingly, all jurisdictions agreed to have their specific trajectories revised.
However, direct comparisons between 2015 data and subsequent years cannot be made. Whilst the method for deriving data for these measures remains unchanged from 2015, there have been changes to data collection methods to improve data quality. For the 2016 National Early Childhood Education and Care Collection (NECECC) the ABS:
- improved its data linkage approach to enhance the accuracy of child counts, resulting in a lower count of preschool enrolments;
- incorporated data from an expanded child identification strategy in the Child Care Management System (CCMS—an input to the NECECC), resulting in a higher count of preschool enrolments from the CCMS data.
Enrolment proportions may exceed 100 per cent for some jurisdictions due to the numerator and denominator being from different sources. The data are also subject to the inconsistent identification of Indigenous status across different data collections.
Year 12 attainment
The main data source used to assess progress against the Year 12 or equivalent attainment target is the ABS Census. While not directly comparable with Census data, the ABS National Aboriginal and Torres Strait Islander Health Survey (NATSIHS) provides an alternative source of data for this target. This report draws Year 12 attainment data from the 2018–19 NATSIHS, while the previous 2019 report drew from the 2016 Census. This report has avoided making direct comparisons between the survey results and Census results due to the differences in methodology. Where change over time has been discussed in this report, comparisons have been made instead between the latest survey results and previous survey results.
While both the 2018–19 NATSIHS and the Census collect information on highest educational attainment, there are slight differences between the wording of the education questions in the NATSIHS non-remote survey, the NATSIHS remote survey and the Census. This may lead to subtle variations in the data.
Since most Census forms are self-completed by respondents, a small number of respondents may not complete the education questions correctly. Invalid or incomplete responses to school completion or qualification questions may result in being categorised as ‘not-stated’. In the NATSIHS, all survey respondents aged over 15 years are assigned a level of highest educational attainment; if they are unable to identify their qualification level, they are categorised as ‘level not determined’.
Other differences between Census and NATSIHS methodologies, which may lead to differences in education attainment data, have been highlighted in the Employment technical note below.
Employment
The main data sources used to assess progress against the employment target are the ABS National Aboriginal and Torres Strait Islander Health Survey (NATSIHS) and Social Survey (NATSISS). While not directly comparable, the ABS Census provides an alternative source of data for this target. This report draws employment data from the 2018–19 NATSIHS, however, the previous 2019 report drew from the 2016 Census. This report has avoided drawing direct comparisons between the survey results and Census results due to the differences in methodology. Where change over time has been discussed in this report, comparisons have been made instead between the latest survey results and previous survey results.
Employment data and the 2018–19 NATSIHS
The 2018–19 NATSIHS collected information from respondents using trained ABS interviewers using a computer based questionnaire. Employment data from the NATSIHS is drawn from a reduced set of questions from the ABS monthly Labour Force Survey (LFS). The questions capture detailed information about working arrangements, job search activities and availability to start work, and are designed to produce reliable national estimates of key economic indicators, including the employment to population ratio, the unemployment rate and the labour force participation rate. All survey respondents aged 15 years and over are categorised as either Employed, Unemployed or Not in the Labour Force.
The overall coverage of the 2018–19 NATSIHS was approximately 33 per cent of Indigenous Australians. The final sample has been weighted to population benchmarks which align with the scope of the survey to account for under-coverage. The benchmarks are based on the most recently released Estimated Resident Population. Data from the NATSIHS are subject to sampling error, which limits more detailed analysis of employment data, such as by local areas, or population subgroups.
Employment data and the 2016 Census
The Census provides a rich snapshot of all people living in the country on Census night. It is the leading source of information for small population groups and areas, and allows for the analysis of employment data at a more detailed level.
Because most Census forms are self-completed by respondents, four questions are used to determine labour force status, to ascertain if a person is working, actively looking for work and available to start work. These questions are simpler than the set of questions in the NATSIHS, and may therefore return a different result. Respondents may not complete the employment questions correctly; incomplete or invalid responses will be given a labour force status of ‘not stated’.
The Census aims to count everyone in Australia on Census night, so it is not subject to sampling error. However, it is subject to some level of undercount—that is, persons missed in the Census. The Census undercount varies across geographies and between different subgroups in the population. The net undercount for Indigenous people in 2016 was 17.5 per cent. Census data are not adjusted for the net undercount, and therefore data on Indigenous employment using the Census may be affected by the net undercount.
Life expectancy
The latest Indigenous life expectancy estimates were published in November 2018 and reported in last year’s Closing the Gap Report. These estimates are updated every five years.
However, caution is required in comparing Indigenous life expectancy estimates over time, because of changing Indigenous identification rates across data collections, including the Census. These changes do not occur at the same rate across states and territories and socio-economic groups.
The jurisdiction which is least impacted by the identification issues noted above is the Northern Territory, where Indigenous status identification is most consistent over time.
Age-standardised mortality
Measurement of Indigenous age-standardised mortality rates is susceptible to quality issues in the data sources used for the population (denominator) and the number of registered deaths (numerator). The population and deaths data sources are subject to different levels of accuracy with regards to Indigenous identification and are also impacted by lags in the registration of births and deaths.
As discussed in the report, the reliability of backcast population estimates tends to decrease the further away the time series moves from the Census upon which they are based. This potentially makes the Indigenous mortality rates over the period 1998 to the 2006 baseline less reliable than rates since 2006.
Indigenous mortality data are also only reported for New South Wales, Queensland, South Australia, Western Australia and the Northern Territory. These five jurisdictions are considered to have adequate levels of Indigenous identification in the deaths data suitable to publish.
Age-standardised mortality trajectories have been developed specifically for New South Wales, Queensland, South Australia, and the Northern Territory, as well as a trajectory for the five jurisdictions combined. Western Australia did not agree to a trajectory when the original trajectories were set in 2010. However, time series analysis for these jurisdictions, including Western Australia, is also used to provide a measure of progress.
As with child mortality and early childhood education, the target trajectories for age‑standardised mortality have also been revised to incorporate the 2016 Census-based population estimates and projections. Using the non-Indigenous mortality rates from 1998 to 2018, the non-Indigenous mortality rates are projected forward to 2031 to provide an end point for the target to close the gap. A straight line trajectory is drawn from the 2031 target year back to the 2006 Indigenous baseline mortality rate. This provides an Indigenous trajectory to the target to close the gap. Actual Indigenous data points are included from the baseline to the current year for monitoring progress against the trajectory.
The previous version of the trajectory drew upon non-Indigenous rates from 1998 to 2012. With the update to the trajectory for the 2016 Census based population estimates, it was also timely to update the 2031 target end point to reflect recent trends in the non‑Indigenous rates to 2018 (the latest available). This makes the target more accurate in the future, recognising the target is to close the gap by 2031.
Mortality trajectory setting is additionally challenging because the Indigenous population projections include an assumption of improving life expectancy, resulting in a larger projected population. This circularity poses challenges for measuring mortality in the years beyond the Census upon which the population projections are based.