Target
Close the life expectancy gap within a generation (by 2031)
Key points
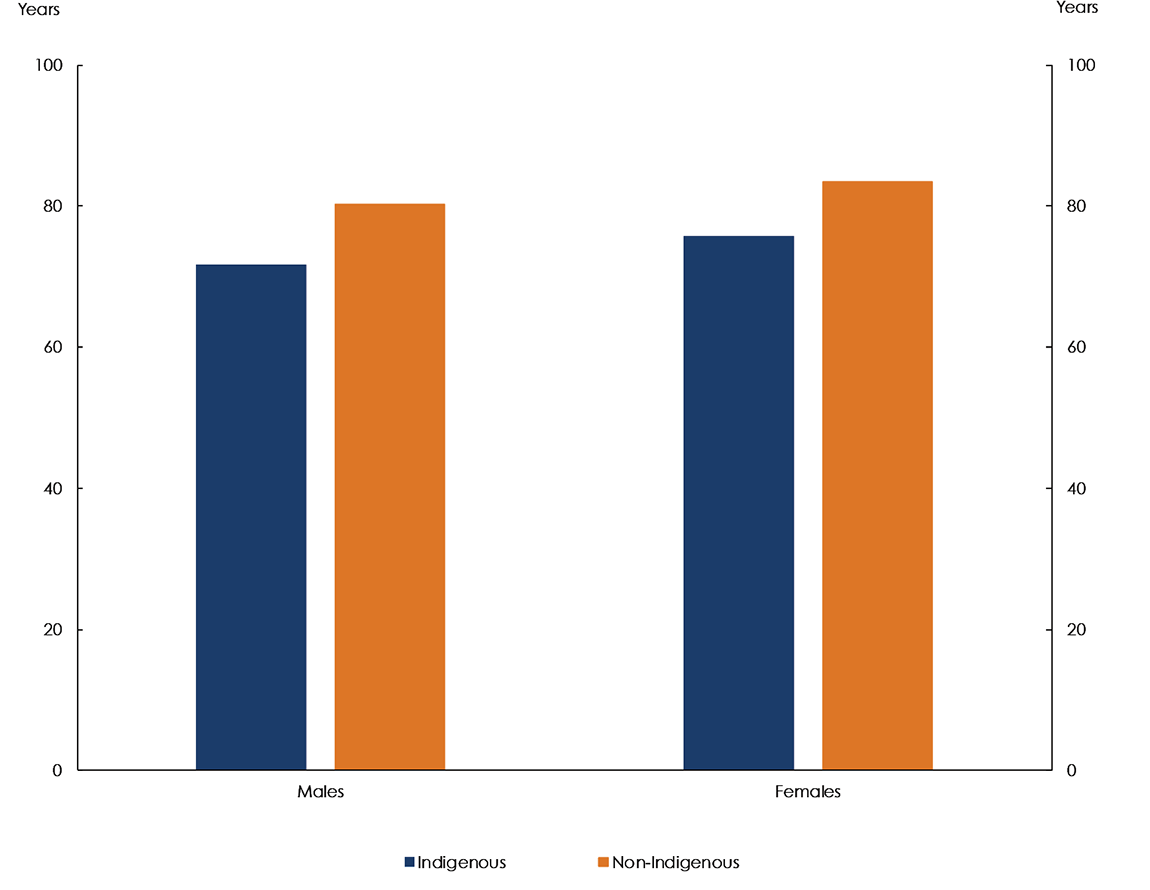
- In 2015–2017, life expectancy at birth was 71.6 years for Indigenous males (8.6 years less than non-Indigenous males) and 75.6 years for Indigenous females (7.8 years less than non-Indigenous females).
- Over the period 2006 to 2018, there was an improvement of almost 10 per cent in Indigenous age‑standardised mortality rates. However, non‑Indigenous mortality rates improved at a similar rate, so the gap has not narrowed.
- Since 2006, there has been an improvement in Indigenous mortality rates from circulatory disease (heart disease, stroke and hypertension). However, this has coincided with an increase in cancer mortality rates, where the gap is widening.
What the data tells us
National
The target to close the life expectancy gap by 2031 is not on track. The life expectancy target is measured using the Australian Bureau of Statistics (ABS) estimates of life expectancy at birth, which are available every five years.1
In 2015–2017, life expectancy at birth was 71.6 years for Indigenous males and 75.6 years for Indigenous females. In comparison, the non-Indigenous life expectancy at birth was 80.2 years for males and 83.4 years for females (Figure 7.1). This is a gap of 8.6 years for males and 7.8 years for females.
Life expectancy is an overarching target, which is dependent not only on health, but the social determinants (such as education, employment status, housing and income). Social determinants are estimated to be responsible for at least 34 per cent of the health gap between Indigenous and non‑Indigenous Australians. Behavioural risk factors, such as smoking, obesity, alcohol use and diet, accounted for around 19 per cent of the gap (AHMAC 2017).
Source: Australian Bureau of Statistics 2018, Life tables for Aboriginal and Torres Strait Islander Australians, 2015–2017, Cat. no. 3302.0.55.003, ABS: Canberra.
View the text alternative for Figure 7.1.
States and territories
As reported last year, New South Wales, Queensland and the Northern Territory—the three jurisdictions with agreed trajectories for the life expectancy target—are not on track to meet the target.
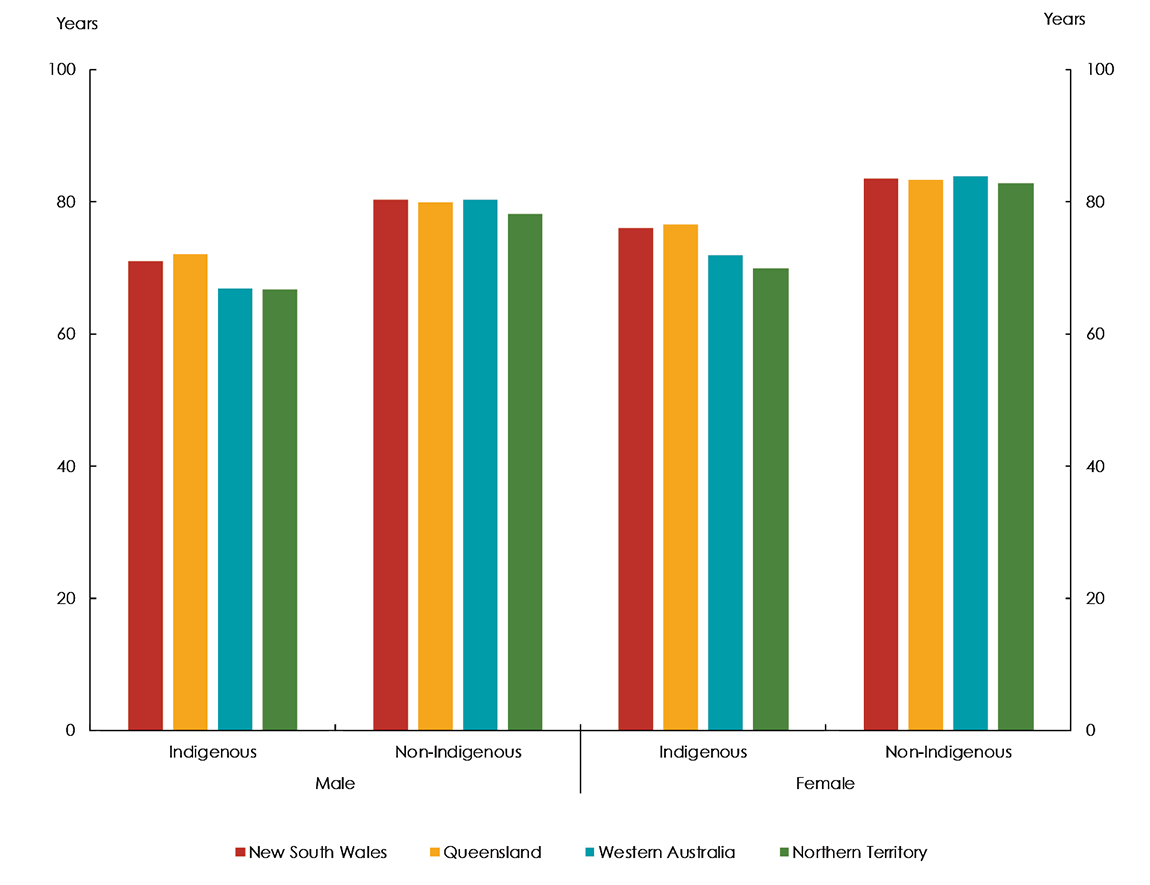
In 2015–2017, Indigenous life expectancy was highest in Queensland (72.0 years for males, 76.4 years for females) and lowest in the Northern Territory (66.6 years for males, 69.9 years for females) (Figure 7.2).
The gap in life expectancy was the largest for males in Western Australia (13.4 years) and for females in the Northern Territory (12.8 years).
Source: Australian Bureau of Statistics 2018, Life tables for Aboriginal and Torres Strait Islander Australians, 2015–2017, Cat. no. 3302.0.55.003, ABS: Canberra.
View the text alternative for Figure 7.2.
Life expectancy by remoteness
Life expectancy for Indigenous Australians living in remote Australia was lower than for those living in urban areas. In 2015–2017, life expectancy for Indigenous males living in Remote and Very Remote areas combined was estimated to be 6.2 years lower than that of Indigenous males living in Major Cities (65.9 years compared with 72.1 years). The equivalent comparison for Indigenous females was 6.9 years lower (69.6 years compared with 76.5 years).
While life expectancy for Indigenous males and females decreases with remoteness, life expectancy for non-Indigenous males and females is similar across all remoteness categories. This means that the gap is widest in Remote and Very Remote areas.
Mortality
Age‑standardised mortality rates2 are used as a proxy to track progress against the life expectancy target annually. This is because the ABS Indigenous life expectancy estimates are only available every five years, while mortality data are available annually.
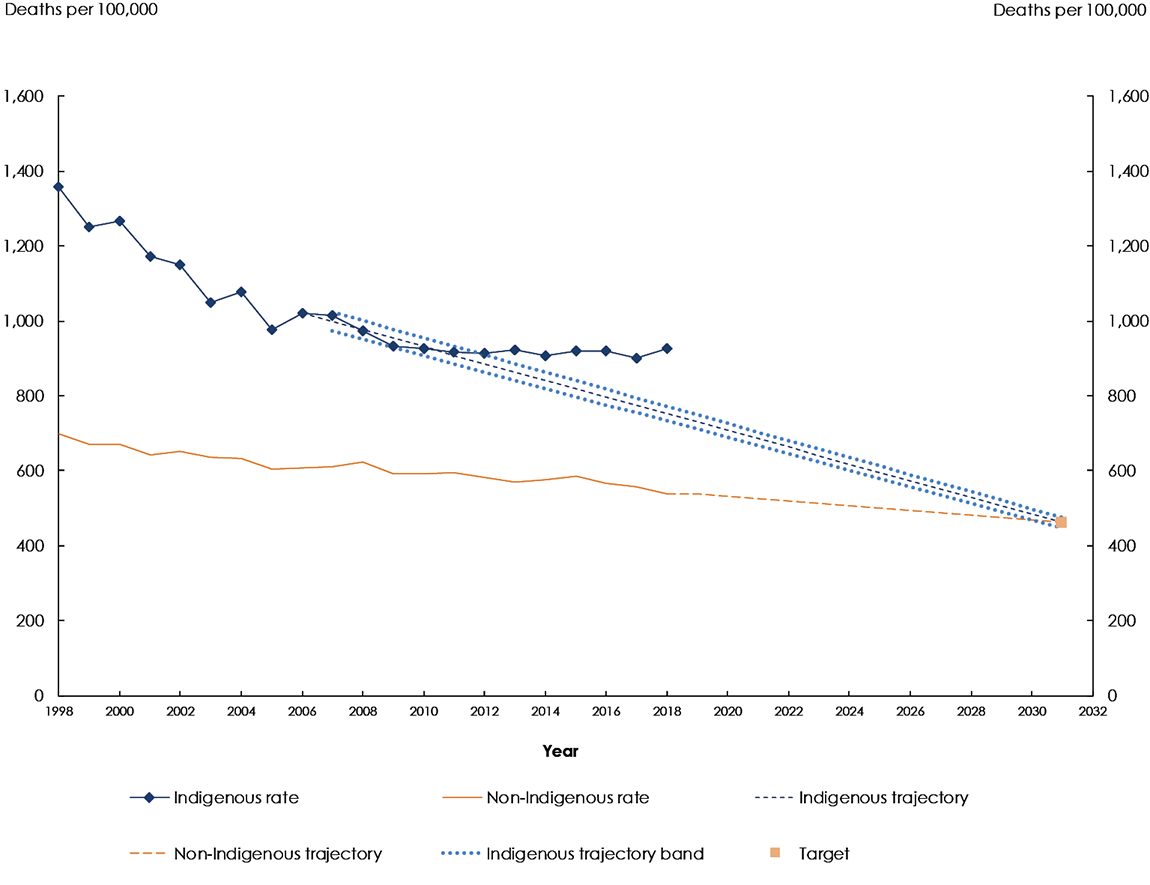
In 2018, there were 3,218 Indigenous deaths (1,780 males and 1,438 females).3 This was equivalent to an age-standardised mortality rate of 927 per 100,000—around 1.7 times the non-Indigenous rate (539 per 100,000). The Indigenous rate was not within the range required to meet the target (Figure 7.3).
Between 2006 to 2018, Indigenous age‑standardised mortality rates improved by almost 10 per cent.4 However, non‑Indigenous rates improved at a similar rate, so the gap has not narrowed. As such, the Indigenous mortality rate has not been on track to meet the target since 2011. The rate of improvement of Indigenous mortality rates has not been as strong as prior to the 2006 baseline.
Further research (including data linkage) is required to understand the reasons why the rate of progress has slowed despite improvements in the detection and management of chronic disease. This is discussed in more detail at Causes of death.
Sources: Australian Bureau of Statistics and Australian Institute of Health and Welfare analysis of the National Mortality Database, unpublished and National Indigenous Reform Agreement Performance Information Management Group, unpublished.
Notes:
a. The Indigenous mortality rates over the period 1998 to 2006 may be less reliable than rates since 2006 as the reliability of population estimates lessens the further away the time series moves from the 2016 Census upon which they are based.
b. The Indigenous trajectory indicates the level of change required to meet the target. The trajectory has been revised to include the 2016 Census-based backcast population estimates. For more information see the Technical Appendix.
View the text alternative for Figure 7.3.
States and territories
Although there is year on year volatility in jurisdictional specific mortality data, New South Wales, Queensland, South Australia and the Northern Territory showed little or no improvement since the 2006 baseline. They are not on track to meet the target.5
However, in Western Australia Indigenous mortality rates improved by 27 per cent between 2006 and 2018, which has contributed to a narrowing of the gap.
Causes of death
Improvements in the mortality rate from circulatory disease (heart disease, stroke and hypertension) have primarily driven improvements in the Indigenous age‑standardised mortality rate. However, since 2006, this has coincided with a worsening of Indigenous cancer mortality rates. In 2017, for the first time, the Indigenous mortality rate from cancer was higher than for circulatory disease. Furthermore, the gap with non‑Indigenous cancer mortality rates is widening.
Further research is required to understand the reasons for changes in the trends in circulatory disease and cancer mortality—the two leading causes of death among Indigenous Australians. The Aboriginal and Torres Strait Islander Health Performance Framework Report provides greater detail about the trends in the other leading causes of death and the factors that drive them (AHMAC 2017).
Reductions in smoking, and improved early detection and management of chronic disease, are playing a vital role in driving gradual improvements in health outcomes impacting on life expectancy. However, later diagnoses of cancer, comorbidities and the types of cancer affecting Indigenous Australians are likely to be contributing to lower cancer survival (AHMAC 2017). It is important to note that population health interventions, such as smoking reduction, have a long lead time before measurable impacts can be seen.
Daily smoking among Indigenous Australians aged 15 years and over has decreased from 41 per cent in 2012–13 to 37 per cent in 2018–19 (ABS 2019b). While this is encouraging, there can be a long lag time for lung cancer to emerge (up to 30 years). This means that smoking related deaths may continue to rise over the next decade before declining, when the longer term impact of smoking reduction may be realised (Lovett et al. 2017).
Between 2003 and 2011, the decrease in the burden from Indigenous smoking-related circulatory disease has coincided with an increase in the burden of smoking-related cancer and respiratory disease (AIHW 2016 as cited by Lovett et al. 2017).6
Data notes
New Indigenous population estimates based on the 2016 Census have been used to rebase the denominator for calculating mortality rates and the trajectory to the target. This potentially makes the Indigenous mortality rates over the period 1998 to 2006 less reliable than rates since 2006.
For more information see the Technical Appendix.
[1] The ABS publishes life tables and calculates life expectancy for the Australian population and by Indigenous status. These Indigenous estimates are based on three years of data (for example, 2015–2017) to reduce the effect of variations in death rates from year to year. Updated estimates of Aboriginal and Torres Strait Islander life expectancy were published by the ABS in November 2018 and were covered in the Closing the Gap Report 2019. The trend in life expectancy estimates has not been presented. Caution is required when interpreting trends in life expectancy estimates, because of changing rates of Indigenous identification across data collections and variation across geographies and socioeconomic groups.
[2] The age‑standardised mortality rate is the overall number of deaths for the population as a proportion of the total population, presented as a rate per 100,000 population and age‑standardised using the direct method to adjust for the differences in the age profiles of the Indigenous and non-Indigenous populations.
[3] ABS Indigenous Australian deaths data are reported for New South Wales, Queensland, South Australia, Western Australia and the Northern Territory only, which are considered to have adequate levels of Indigenous identification suitable to publish.
[4] The trend in Indigenous age-standardised mortality rates was statistically significant. References to per cent change in mortality rates in this chapter are derived through linear regression analysis, and tested at the 5 per cent level of significance. For details on the specifications for the mortality indicator used in this report, refer to the NIRA data specifications on the AIHW METeOR website.
[5] Target trajectories, using age-standardised mortality rates as an annual proxy for life expectancy, have been agreed for New South Wales, Queensland, South Australia and the Northern Territory. Western Australia did not agree to a target trajectory when the original trajectories were set in 2010. For more information see the Technical Appendix.
[6] The trends in the burden of smoking-related diseases for Indigenous Australians have not been tested for statistical significance.