Target
Close the gap between Indigenous and non-Indigenous school attendance within five years (by 2018)
Key points
- The majority of Indigenous students attended school for an average of just over 4 days a week in 2019. These students largely lived in Major Cities and regional areas.
- School attendance rates for Indigenous students have not improved over the past five years. Attendance rates for Indigenous students remain lower than for non‑Indigenous students (around 82 per cent compared to 92 per cent in 2019).
- Gaps in attendance are evident for Indigenous children as a group from the first year of schooling. The attendance gap widens during secondary school. In 2019, the attendance rate for Indigenous primary school students was 85 per cent—a gap of around 9 percentage points. By Year 10, Indigenous students attend school 72 per cent of the time on average—a gap of around 17 percentage points.
What the data tells us
National
The target to halve the gap for Indigenous children in school attendance within five years (by 2018) was not met.
School attendance is associated with a range of interrelated and complex factors (DETE 2013). Parent’s education levels, occupation and employment status have been linked to school attendance (Hancock et al. 2013). Where students live, their socio‑economic status and their mobility (measured by new school enrolments) have also been associated with school attendance.
Based on Semester 1 school attendance rates for Years 1 to 10, attendance has not improved for Indigenous students over the past five years to 2019.1
Over this period, attendance rates have declined by around 1.2 percentage points for non-Indigenous students and around 2.0 percentage points for Indigenous students (Figure 3.1).2 The reasons for school absences (including the prevalence of unexplained absences) are not reported on a consistent basis across states and territories. As such, the drivers of the recent changes in attendance rates could not be considered.
Indigenous students attended school for around 82 per cent of the time in 2019—that is, for just over 4 days a week on average. This is around 10 percentage points lower than the attendance rate for non‑Indigenous students (92 per cent). The gap did not narrow between 2014 and 2019.
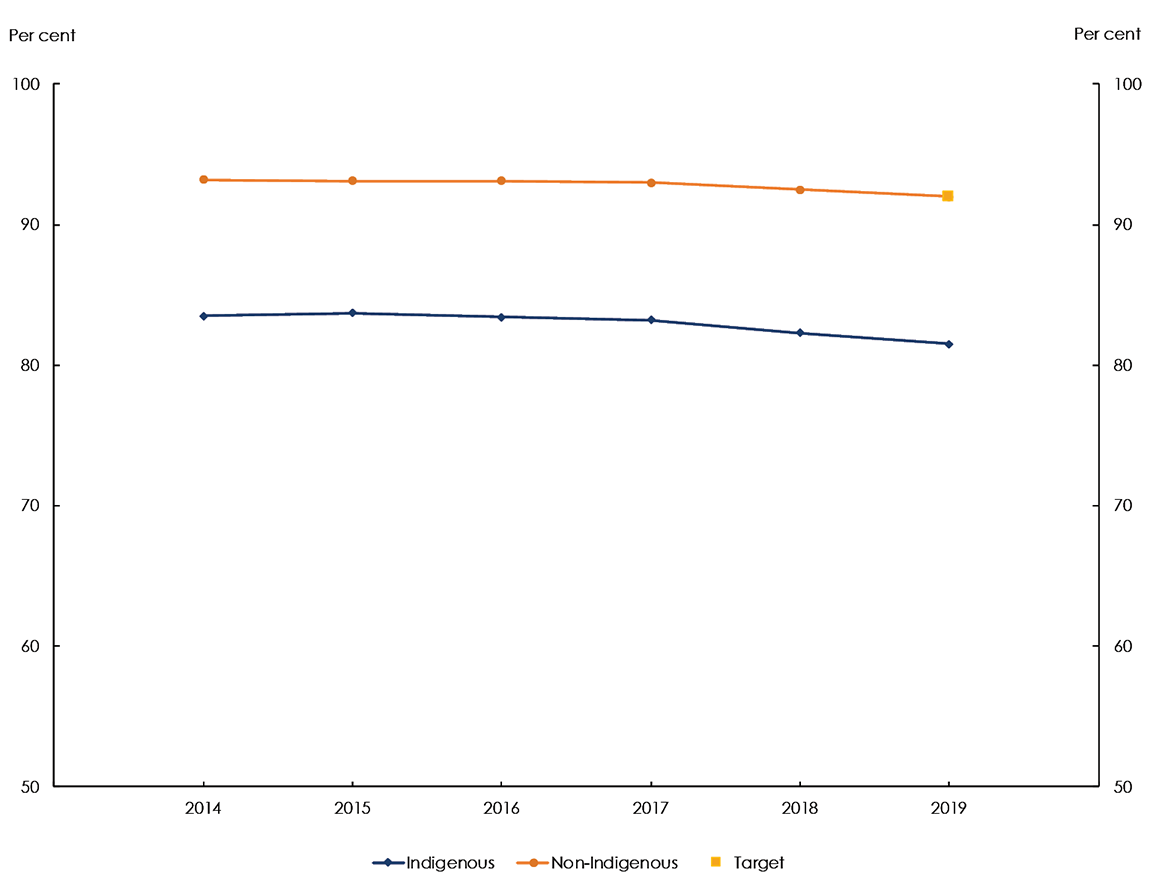
Source: Australian Curriculum, Assessment and Reporting Authority, 2019, unpublished.
View the text alternative for Figure 3.1.
Primary and secondary school outcomes
From the first year of schooling there is a gap in attendance for Indigenous children (Figure 3.2). Evidence suggests attendance gaps are influenced by factors and events that occur before a child starts school, including caregiver expectations towards education, family functioning and the health of family members (Keating and Hertzman 1999; Gray and Beresford 2002; Dalziel and Henthorne 2005; Zubrick et al. 2006; Hancock et al. 2013).
The gap in attendance is carried through and widens during secondary school. For Indigenous primary school students, the gap was around 9 percentage points in 2019. A larger fall is seen in attendance during Years 7 to 10 for Indigenous students. By Year 10, the attendance gap widened to around 17 percentage points (Figure 3.2).
Regular school attendance has been associated with improvements in NAPLAN outcomes at the individual and school level (DETE 2013; Hancock et al. 2013; Ladwig and Luke 2014).
Evidence from Queensland suggests poor school attendance during the early years has a greater impact on student performance than during later years. Based on 2009 NAPLAN results for Queensland students in government schools, the effect of attending school for 95 per cent of the time or less (10 or more days absent) on reading outcomes was estimated to be around 2.1 times greater for Year 3 students compared with Year 9 students (DETE 2013). The effect of attending school for 85 per cent or less (30 or more days absent) on reading outcomes was around 1.2 times greater during Year 3 compared with Year 9.
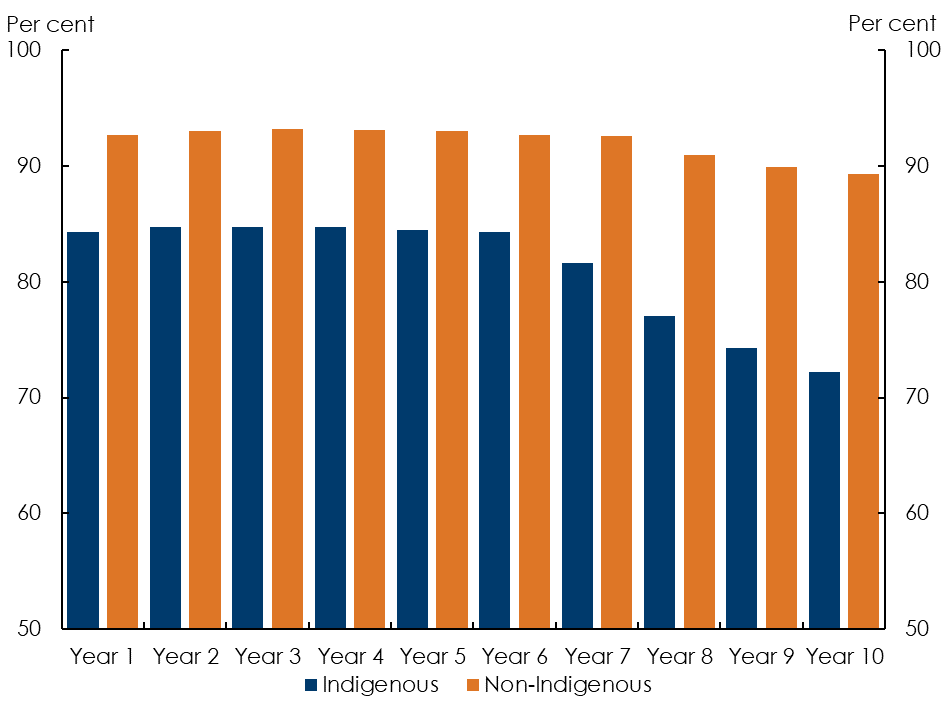
Source: Australian Curriculum, Assessment and Reporting Authority, 2019, unpublished.
View the text alternative for Figure 3.2.
States and territories
The target to halve the gap for Indigenous children in school attendance within five years was not met in any state or territory.
Attendance rates for Indigenous students declined to some extent in all jurisdictions over the past five years (Figure 3.3). Except for the Northern Territory, this decline largely occurred between 2017 and 2019. The decline has been observed across both the Indigenous and non‑Indigenous student population.
Between 2014 and 2019, school attendance declined by less than 2 percentage points in Victoria, Queensland, South Australia and Tasmania. Together these four states accounted for 46 per cent of Indigenous school-aged children (5–16 years old) in 2016 (ABS 2016).
For Indigenous students in Northern Territory, however, school attendance fell by around 7 percentage points over the period. That said, nearly three in five Indigenous children (aged 5–16 years old) in the Northern Territory lived in Very Remote areas in 2016 (ABS 2016). Across Australia, Very Remote areas saw the largest decline in Indigenous attendance rates between 2016 and 2019, with a fall of around 5 percentage points to 61 per cent in 2019 (Figure 3.4).3
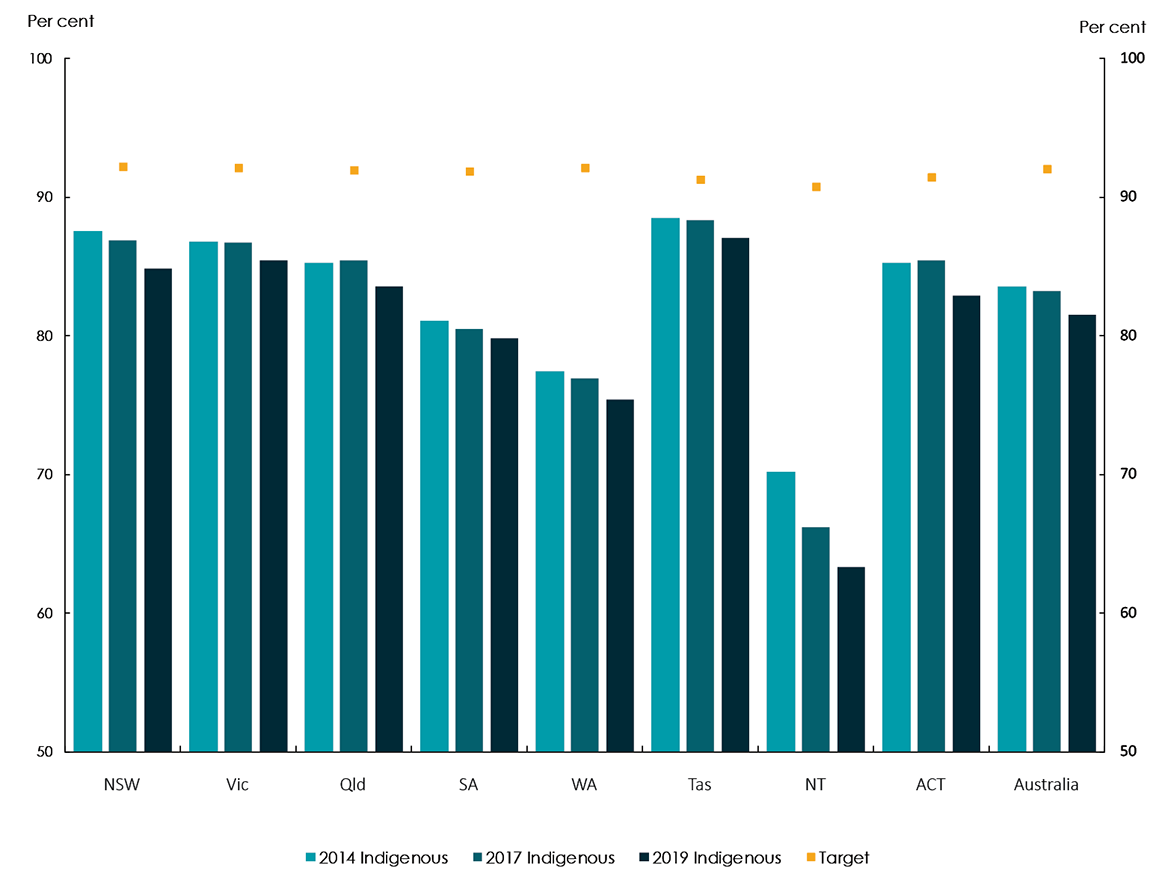
Source: Australian Curriculum, Assessment and Reporting Authority, 2019, unpublished.
View the text alternative for Figure 3.3.
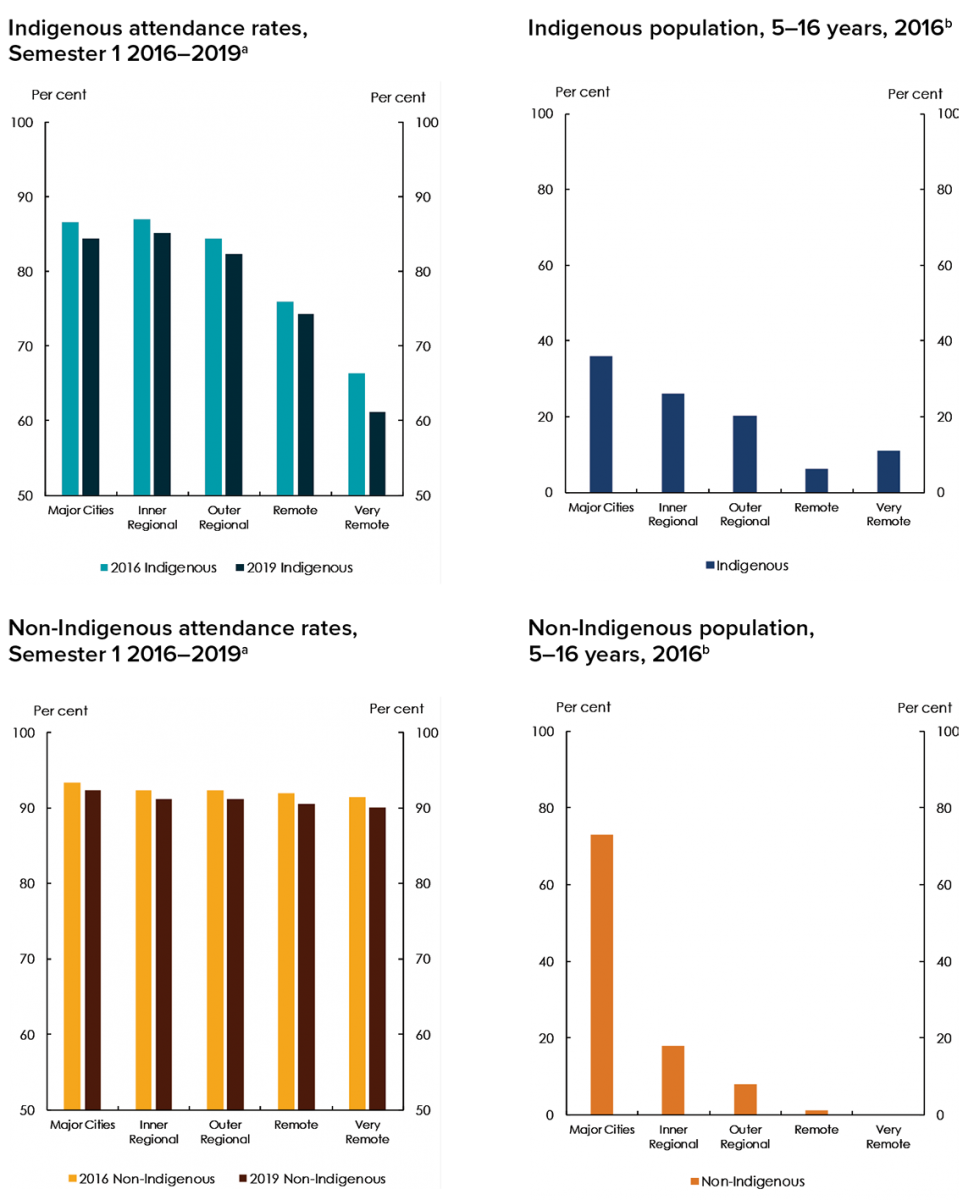
Sources: Australian Bureau of Statistics, 2016, Census of Population and Housing, TableBuilder. Findings based on use of ABS TableBuilder data; Australian Curriculum, Assessment and Reporting Authority, 2019, unpublished.
Notes:
- As remoteness categories were updated in 2015, changes in attendance by remoteness cannot be compared prior to 2016.
- Population proportion based on 2016 Census counts of 5 to 16 year-old children.
View the text alternative for Figure 3.4
Geographic analysis
The majority of Indigenous students attended school for an average of just over 4 days a week. These students largely lived in Major Cities and regional areas (Figure 3.4).
For the 17 per cent of Indigenous children aged 5 to 16 years living in Remote and Very Remote Australia (ABS 2016), children attended 3 to 4 days per week on average. In comparison, school attendance rates for non‑Indigenous students do not vary substantially by remoteness (Figure 3.4).
Consideration of any one factor, however, cannot provide a comprehensive understanding of school attendance for Indigenous students. A more detailed geographic level analysis of attendance accounting for students’ year level and where they live, provides a better understanding of what is happening ‘in place'.
Very Remote Indigenous primary school students in New South Wales, for example, attended school 4 to 5 days per week on average in 2019 (Figure 3.5). In other states, Very Remote Indigenous primary school students attended on average 3 to 4 days per week. For the Northern Territory it was as low as 2 to 3 days per week (around 56 per cent).
At a national level, attendance rates dropped off during secondary school (Figure 3.2). The extent of the drop varied across Australia (Figure 3.5 and Figure 3.6). Notably, average attendance rates of 2 to 3 days per week extended to Indigenous secondary students living in Remote and Very Remote areas of the Northern Territory, as well as Indigenous students in Very Remote areas of Western Australia and South Australia.
The relatively high Remote and Very Remote Indigenous attendance rates for primary school students in New South Wales were not evident in secondary school. Attendance rates also declined to 3 to 4 days per week for Indigenous secondary students living in Outer Regional areas of Western Australia and Queensland.
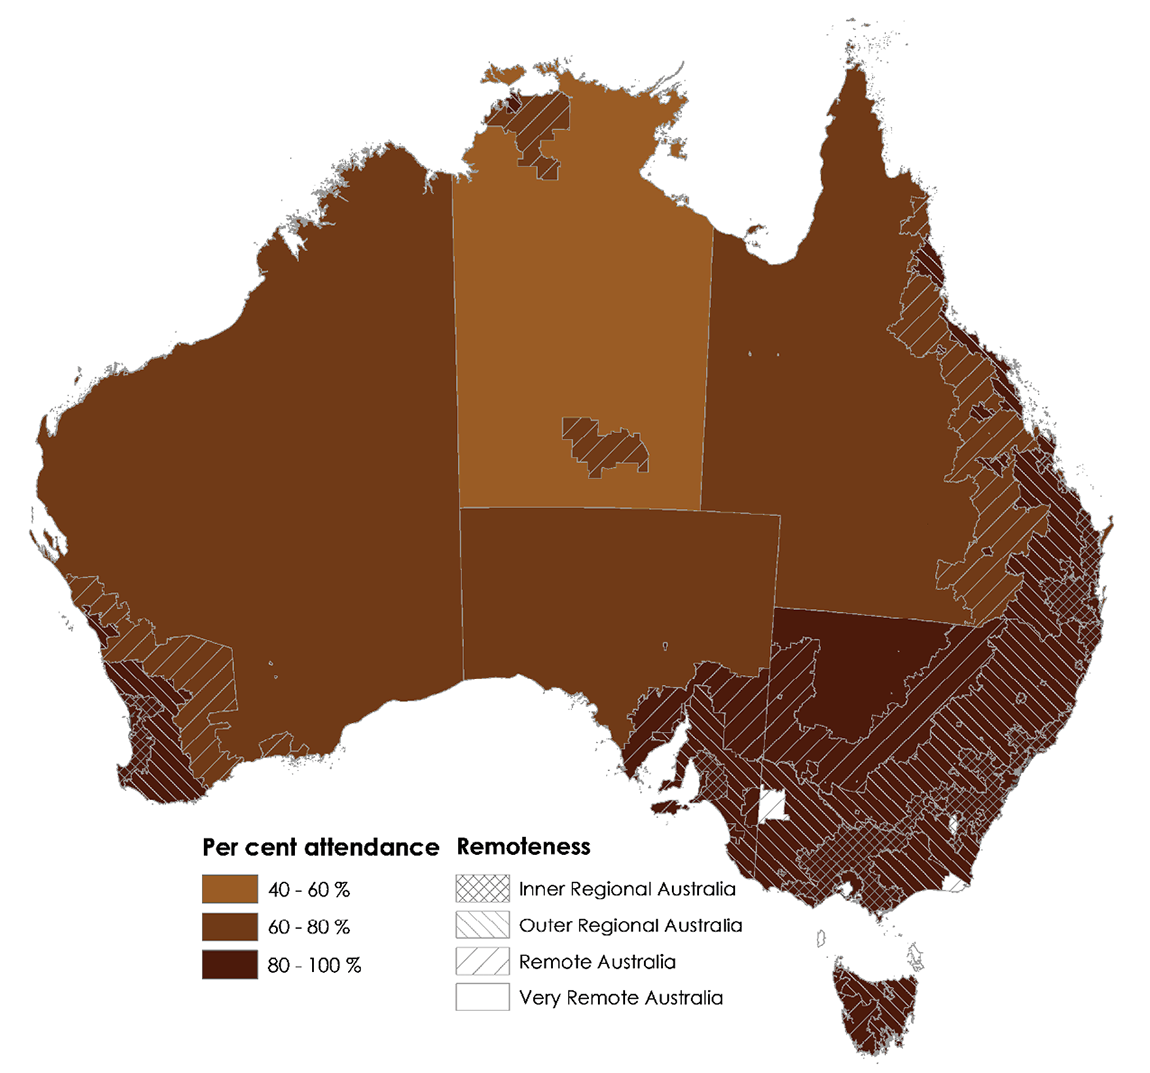
Source: Australian Curriculum, Assessment and Reporting Authority, 2019, unpublished.
Notes:
- For the Australian Capital Territory, as well as some areas in Tasmania and Victoria, results cannot be published due to low numbers of Indigenous students or schools.
- The map provides an indication of the variation in primary school attendance across Australia. Confidence intervals—that is, the level of uncertainty associated with the measurement of results—within a remoteness area and jurisdiction are not available.
View the text alternative for Figure 3.5.
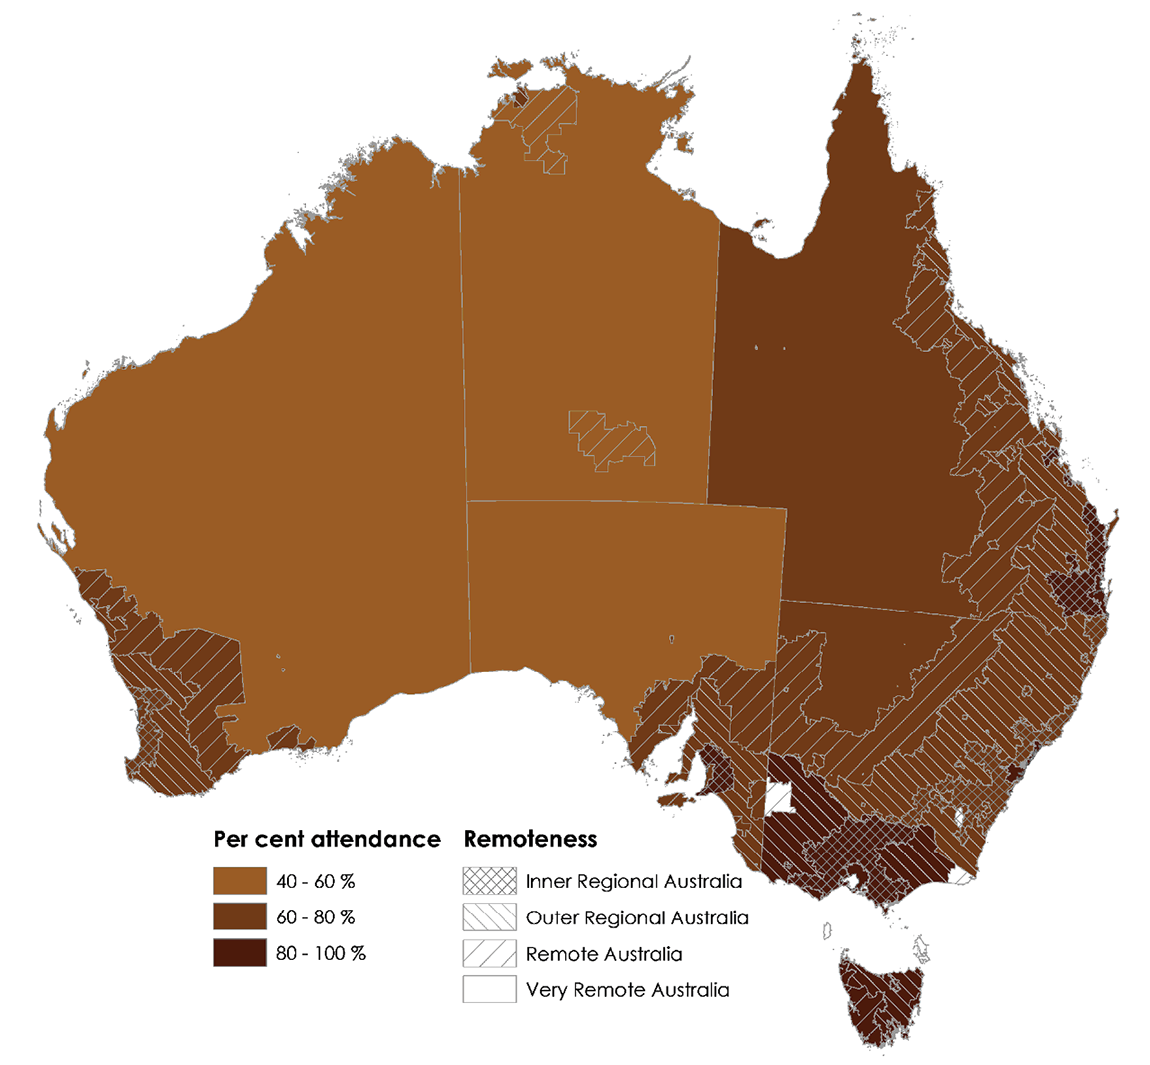
Source: Australian Curriculum, Assessment and Reporting Authority, 2019, unpublished.
Notes:
- For the Australian Capital Territory as well as some areas in Tasmania and Victoria, results cannot be published due to low numbers of Indigenous students or schools.
- The map provides an indication of the variation in secondary school attendance across Australia. Confidence intervals—that is, the level of uncertainty associated with the measurement of results—within a remoteness area and jurisdiction are not available.
View the text alternative for Figure 3.6.
[1] The Australian Curriculum, Assessment and Reporting Authority (ACARA) collects school attendance data for Semester 1 and Term 3 each year. Semester 1 2019 attendance data are used to evaluate the target, because they better represent changes in school attendance during 2018.
[2] The statistical significance of changes in attendance rates are not reported by ACARA.
[3] Remoteness categories in the ACARA attendance data were updated in 2015. As a result, changes in attendance by remoteness cannot be compared prior to 2016.